Spot patterns before they become problems
Track engagement, monitor symptom trends, and surface risk flags across your entire patient population. Actionable data for clinicians, not dashboards for data scientists.
You can't improve what you can't see
Between visits, clinicians have almost no visibility into how patients are doing. Progress notes capture a snapshot. Patient recall is unreliable. By the time a trend becomes obvious, weeks have passed.
Nudge captures structured data with every interaction. Engagement patterns, symptom responses, and completion rates are tracked automatically and organized for clinical review.
Therapy dropout after first visits
Over 70% of all mental health treatment dropout occurs after the first or second visit, before therapeutic gains can take hold.
World Mental Health Surveys / PMC, 2021Physicians experiencing burnout symptoms
43.2% of physicians reported at least one burnout symptom in 2024. Those with insufficient documentation time are 2.8x more likely to burn out.
AMA / Mayo Clinic Proceedings, 2024Patient time spent in clinical settings
With an average visit lasting 20 minutes and 2-4 visits per year, patients spend less than 1% of their time with a clinician and the rest managing health alone.
Annals of Internal Medicine, 2024From raw responses to clinical signals
Every Nudge interaction feeds into a unified analytics layer. No manual data entry, no spreadsheet exports.
Know who's engaged and who's going quiet
Track open rates, completion rates, and response patterns across every Nudge and workflow. Declining engagement surfaces automatically so your team can follow up before patients disengage completely.
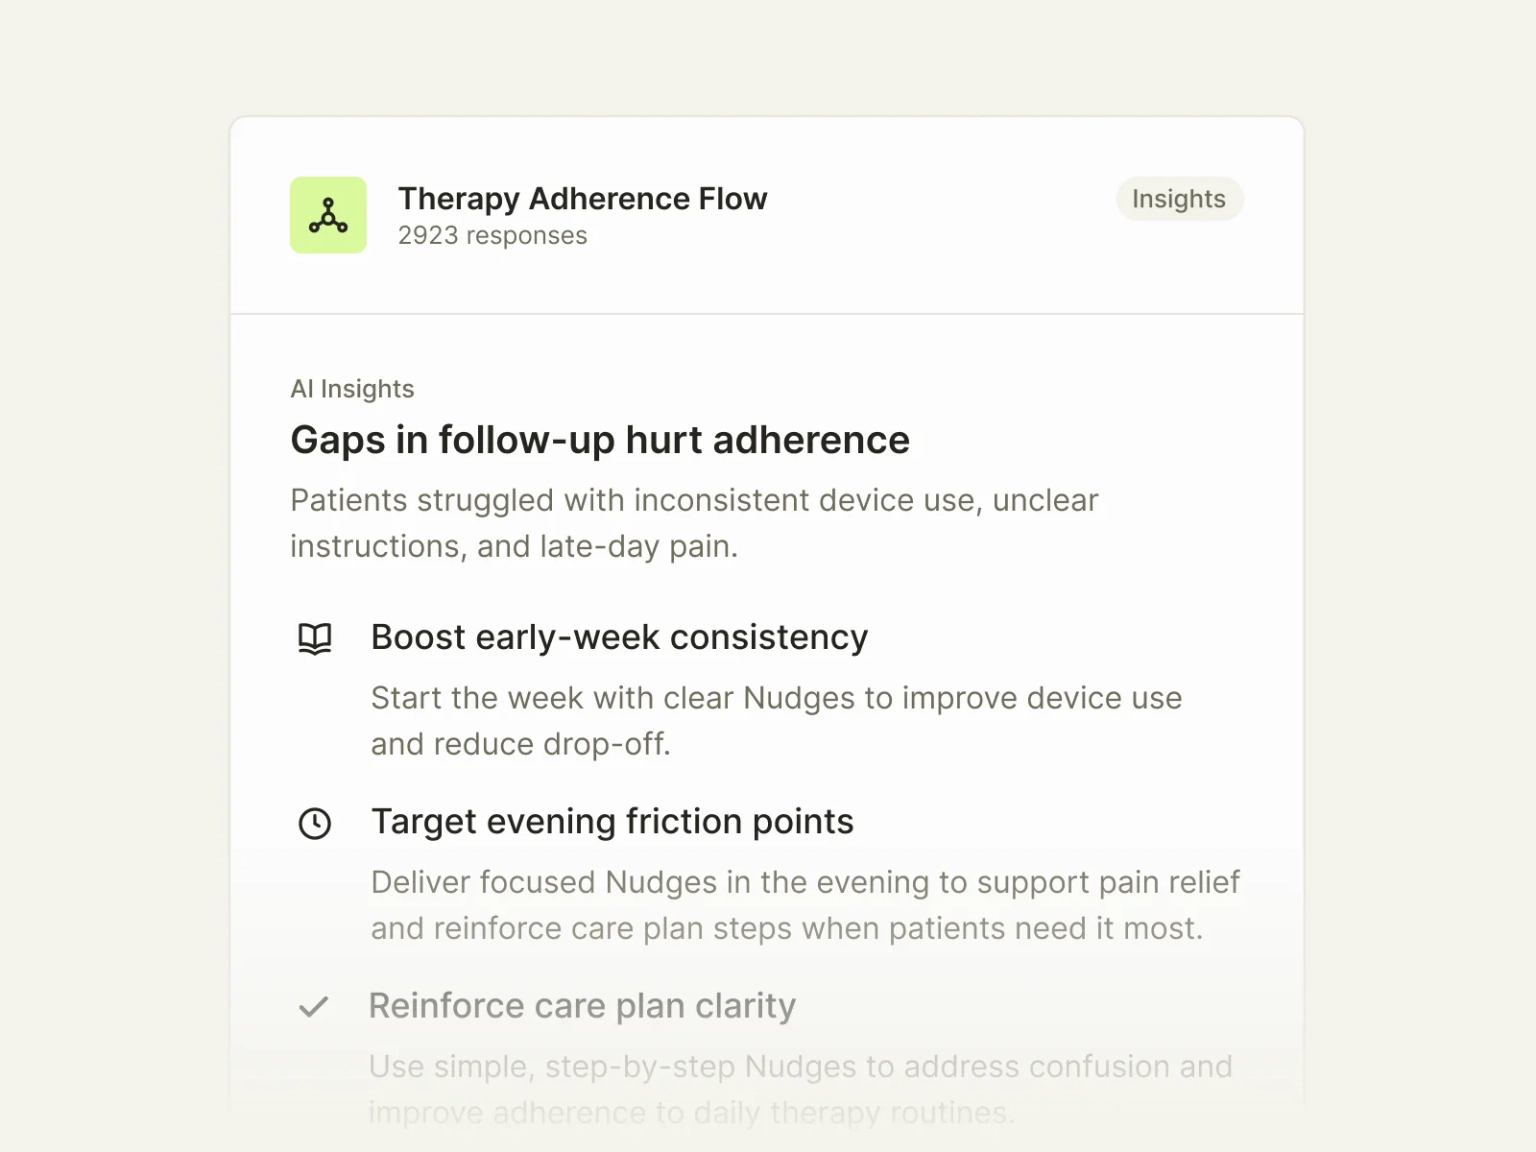
AI-powered analytics that surface what matters
AI reviews patient responses to highlight trends a human reviewer might miss. Sentiment analysis, automated summaries, anomaly detection, and suggested actions help clinicians act faster with less manual review.

Longitudinal symptom tracking across domains
Responses tagged with symptom domains like anxiety severity, functional impact, and emotional regulation are classified as improving, stable, or declining over time. Clinicians see trends, not isolated data points.
Concerning patterns surfaced before the next visit
When a patient's trend shifts from stable to declining, or engagement drops significantly, the system flags it. Clinicians review flagged patients first, focusing time where it matters most.
Raw responses organized for clinical review
The evidence view pulls a patient's responses across all Nudges and workflows into a single timeline. Clinicians see what the patient said, when they said it, and in what context.
"We used to guess which patients were struggling. Now our clinicians log in and the data is already there, organized by trend and risk level. It completely changed how we allocate clinical attention across the practice."
Founder, KuduCare

See your patient data come to life
Book a walkthrough and we'll show you how Nudge turns every patient interaction into actionable insight.
Get in touch